
Tools & Data
Average Tech Company Post-IPO Returns
The majority of technology companies decline in value after going public
Post-IPO, the Odds Are Still (Unfortunately) Against You
If you're a tech employee, your company having an IPO is usually a very celebratory event (and also raises many important planning questions). As you develop your IPO/Going Public plan, one of the key questions to know/understand is how you anticipate the company will perform financially post-IPO.
The reality is there is absolutely no way to know! Public markets are highly liquid with millions of buyers/sellers. This makes the market "efficient", and also makes trying to pick which stocks will over/under perform a losing game (this has been analyzed at nauseam and for all intents and purposes is "proven").
More Than 70% of Tech Companies Underperform Post-IPO
Just like we provided data regarding how pre-IPO technology companies financially perform (to help improve decision making), post-IPO there is robust data detailing how technology companies' stock price performs after going public. And, unfortunately, its more of the same story: most tech companies underperform post-IPO. The economic research team over at Nasdaq has done a phenomenal job analyzing the data --> and we've provided below the two most insightful charts from their analysis.
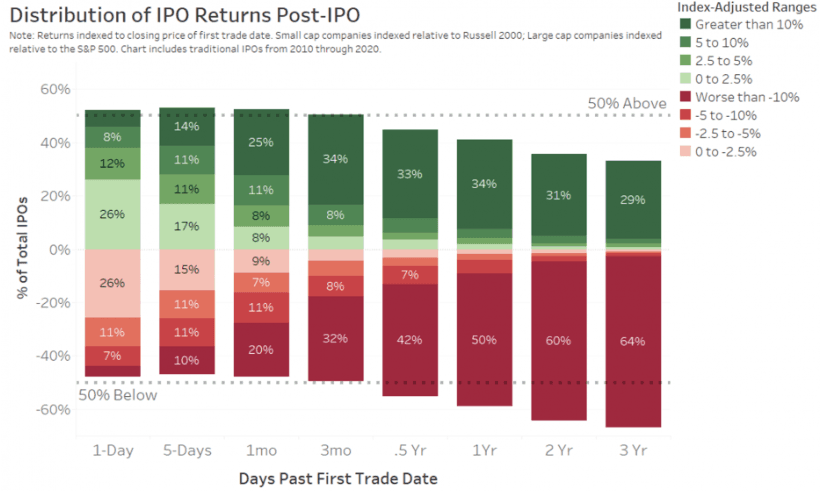
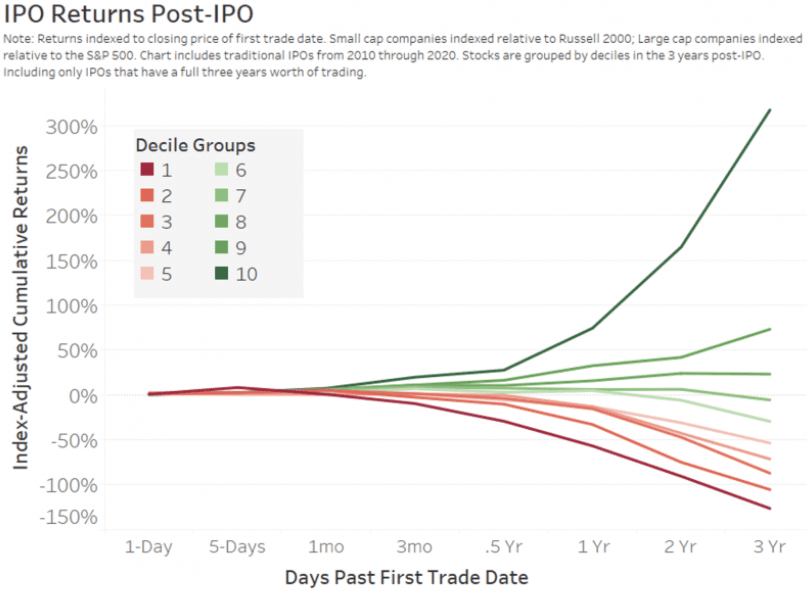
Source: https://www.nasdaq.com/articles/what-happens-to-ipos-over-the-long-run-2021-04-15
A Similar Dynamic Exists Across Industries
The above dynamic shows (1) an attractive overall return for the total group of companies, (2) but that the return profile is driven by top-decile performers, (3) with the majority of companies actually underperforming -> is not actually unique to the tech industry. Rather, it exists across across most industries over time. For more information, see Single Company Stock Performance In S&P 500.
How to Use Post-IPO Returns Data in Your Financial Plan
If your company recently went public, you're likely focused on designing your selling/divestment plan. And as you do so, you may also be using our simple (but powerful) framework to value your company. As you estimate/consider what the probabilities are for each type of financial outcome, this data should help you better understand what high, low, and median range of outcomes could plausibly be.
The Equity Advantage
Go past the basics.
Kris's letter on the decisions these basics lead to: when to exercise, what to sell, and how to keep the tax bill down. 4,200+ subscribers.
Subscribe on LinkedInHave $2M+ in company equity and a decision ahead? See who we work with
Most Similar
Selected by content similarity, not just shared category.
Next Step
Want this applied to your situation?
A 30-minute consult will tell you whether the framework in this article applies cleanly to your equity package — and if so, what the next three moves are. No pitch.